
Inverse graph chart Meme Generator
Create Your Inverse graph chart Meme
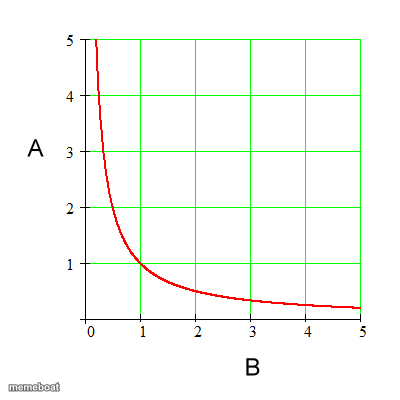
A simple red curve on a graph plunging from high A to low B, the go-to chart for showing an inverse relationship. Add your own labels and download free.
Blank Inverse graph chart meme template
Download the blank Inverse graph chart template to caption it yourself, or add your text right here in the editor above and download the finished meme.
When to use the Inverse graph chart meme
- Showing how effort decreases as deadline gets closer
- Illustrating that confidence drops as actual knowledge increases
- Sleep hours vs number of tabs open in your browser
- How much you care vs how many group projects you've survived
Inverse graph chart template facts
- Dimensions
- 400 × 400 px
- Format
- PNG
- Added
- 2025
About the Inverse graph chart meme template
One line, one curve, one universal truth: as one thing goes up, the other goes down. This graph has been used to explain economics, physics, and relationship dynamics, and honestly it works for all three.
Swap the axis labels for whatever inverse relationship you're roasting, sleep vs stress, effort vs grades, confidence vs actual skill. It's simple, it's clean, and it makes your dumb joke look scientifically rigorous.
Popular Inverse graph chart caption ideas
MY SANITY · THE AMOUNT OF GRAPHS I HAVE TO MAKE FOR MATH CLASS.
Templates similar to Inverse graph chart


Inverse graph chart meme FAQ
How do I make a Inverse graph chart meme?
Scroll up to the Inverse graph chart template, add your own text boxes in the editor above and type your captions, adjust the font, size and color if you like, then click download. Your finished Inverse graph chart meme is ready to share in seconds.
Can I use the Inverse graph chart template for free?
Yes. The Inverse graph chart template is completely free to use — no signup and no limits on how many memes you create or where you share them.
How do I download my Inverse graph chart meme?
Click the download button under the editor once your Inverse graph chart meme looks right. It saves straight to your device as a high-quality PNG or JPEG image.
How do I download the blank Inverse graph chart template?
Use the "Download blank template" button in the blank Inverse graph chart template section above to save the original, un-captioned image — handy if you'd rather caption it in another app or keep a copy.